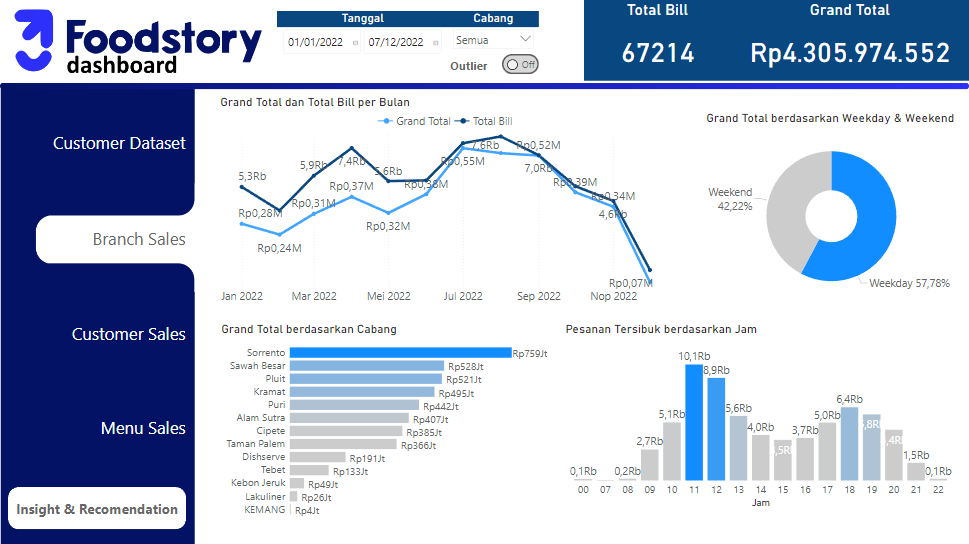
Foodstory Dashboard
This Dashboard utilizes the Foodstory - Cloud Kitchen dataset to analyze sales data from 2021-2022 in Indonesia. Through this dashboard, we aim to provide critical insights into sales performance at the branch, customer, and menu levels. Additionally, we examine customer data to gain a better understanding of Foodstory's customer base. With our visually appealing and interactive dashboard, we provide easy-to-understand visualizations that allow stakeholders to make informed decisions based on the insights gathered.
Learn more
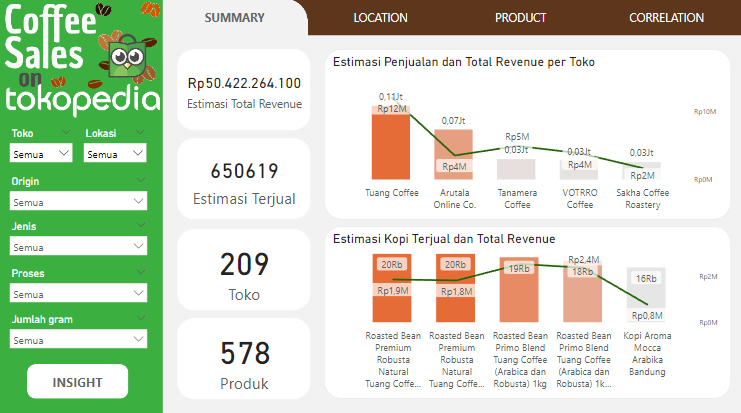
Tokopedia Coffee Sales
Immerse yourself in the captivating world of coffee sales on Tokopedia with our meticulously crafted Coffee Sales Dashboard. Powered by Python's data scraping capabilities, this dynamic and user-friendly dashboard presents a panoramic view of estimated sales and revenue from 209 stores and 578 unique coffee products. Created using Power BI, it offers visually stunning charts, graphs, and interactive elements, providing valuable insights into the thriving coffee industry. Uncover emerging trends, make data-driven decisions, and take your coffee business to new heights.
Learn more
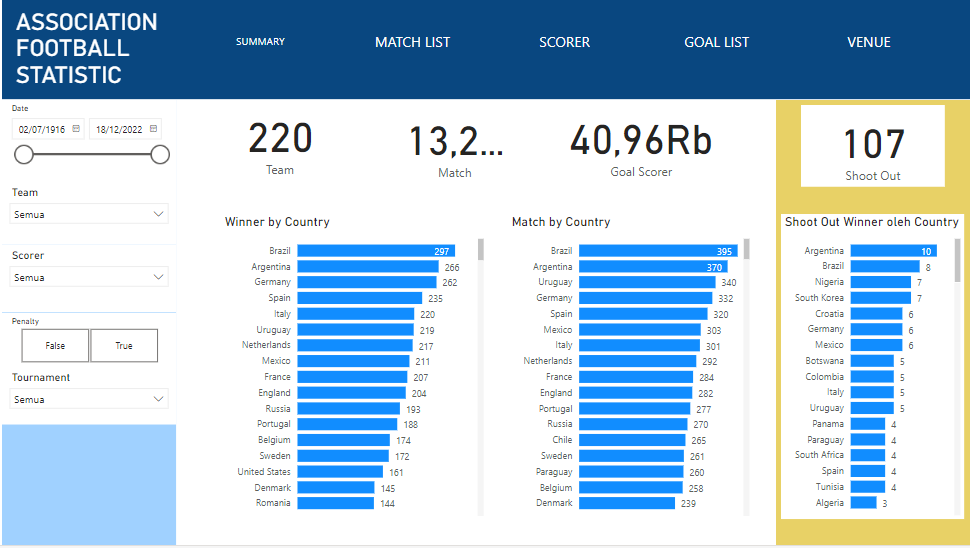
Association Football Statistic
This dashboard provides an in-depth analysis of international association football matches from 02/07/1916 to 18/12/2022. It includes information on teams, goalscorers, match listings, venues, and tournaments. By exploring this data, you can gain valuable insights into the best-performing teams and players in international football during this time period. Whether you're a fan, researcher, or analyst, this dashboard offers a comprehensive view of the sport that can help inform decision-making and spark new ideas.
Learn more
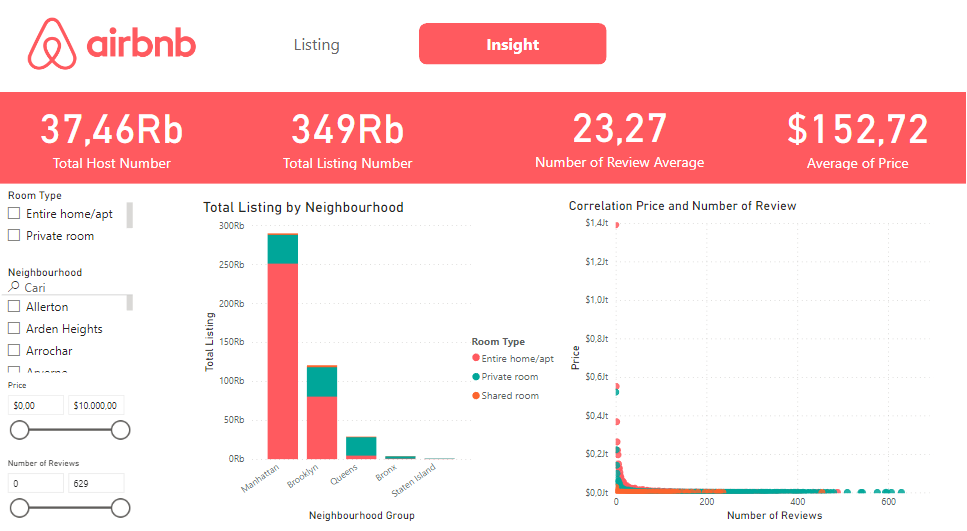
Airbnb Listing
Explore the world of Airbnb in New York City with this dashboard, which analyzes the listings of 5 neighborhood groups: Manhattan, Brooklyn, Queens, Bronx, and Staten Island. The dashboard provides an overview of the listings, including the quantity and pricing details, as well as insights through 2 charts that showcase the correlation between price and the number of reviews. This dashboard is designed to help you gain a deeper understanding of the Airbnb market in New York City and identify trends across different neighborhoods.
Learn more

Formula 1 Statistic
This Formula 1 dashboard analyzes race statistics from 1950 to 2022, including information on races, constructor teams, drivers, and circuits. It provides insights into the performance of the top teams and drivers over the given period, helping to identify patterns and trends. Whether you're a die-hard Formula 1 fan or just interested in data analysis, this dashboard offers a fascinating glimpse into the world of high-speed racing.
Learn more